Spacetraders 4: Visualizing the starting system
Playing around the “quickstart” guide made me realize that it’s very helpful to have at least simple overview of the system I get thrown into at the beginning of the game

The goal for this week reset was modest:
fetch my starting system from the API
group waypoints by type (planets, asteroids, stations, jump gate, …)
plot a 2D map in the system coordinates
build a 3D version that separates waypoints that sit on top of each other
This turned out to be a nice exercise in data shaping, and also the first point where I hit a wall trying to do everything “by hand” and ended up asking an AI assistant for help.
Fetching the system and its waypoints
I keep the basic HTTP helpers from the first post and add a small wrapper around my current headquarters:
import datetime
from pathlib import Path
from dotenv import dotenv_values
import requests
import numpy as np

BASE_URL = "https://api.spacetraders.io/v2"

def send_GET(endpoint: str, headers: dict) -> dict:
    url = f"{BASE_URL}/{endpoint}"
    r = requests.get(url, headers=headers, timeout=10)
    r.raise_for_status()
    return r.json()
For each weekly reset I use a separate folder and .env file. The timestamp used as the folder name is taken from the BASE_URL API, that returns the game state:
status = requests.get(BASE_URL)
reset_date = datetime.datetime.strptime(status.json()["resetDate"], "%Y-%m-%d")

root_name = f"{reset_date.year}w{reset_date.isocalendar().week}"
ROOT_PATH = Path(root_name)

config = dotenv_values(ROOT_PATH / ".env")
AGENT_TOKEN = config["AGENT_TOKEN"]

agent_headers = {
    "Authorization": f"Bearer {AGENT_TOKEN}",
    "Content-Type": "application/json",
}
The endpoint I used to fetch the system data was BASE_URL/systems/{system_symbol}. The interesting part of that payload is the data["waypoints"] list. From there, I pull out a few core attributes into NumPy arrays, that are going to be the raw material for both 2D and 3D plots.
waypoints = starting_system["data"]["waypoints"]

symbols       = np.array([wp["symbol"] for wp in waypoints])
types         = np.array([wp["type"]   for wp in waypoints])
n_orbitals    = np.array([len(wp["orbitals"]) for wp in waypoints])
x_coordinates = np.array([wp["x"]      for wp in waypoints])
y_coordinates = np.array([wp["y"]      for wp in waypoints])
Grouping waypoints by type
In the previous post I mentioned that waypoints can be planets, moons, asteroid fields, stations, jump gates, and so on. For plotting, I want each type to have:
its own color
its own marker shape
a separate entry in the legend
I collect waypoints into a dictionary keyed by type:
waypoints_by_type = {}

for wp_type in types:
    indices = [i for i, t in enumerate(types) if t == wp_type]
    waypoints_by_type[wp_type] = {
        "symbol":       [symbols[i]       for i in indices],
        "n_orbitals":   [n_orbitals[i]    for i in indices],
        "x_coordinates":[x_coordinates[i] for i in indices],
        "y_coordinates":[y_coordinates[i] for i in indices],
    }
Then I define a fixed mapping from waypoint types to colors and markers:
waypoint_types = [
    "PLANET",
    "GAS_GIANT",
    "MOON",
    "ORBITAL_STATION",
    "JUMP_GATE",
    "ASTEROID_FIELD",
    "ASTEROID",
    "ENGINEERED_ASTEROID",
    "ASTEROID_BASE",
    "NEBULA",
    "DEBRIS_FIELD",
    "GRAVITY_WELL",
    "ARTIFICIAL_GRAVITY_WELL",
    "FUEL_STATION",
]

waypoint_colors = [
    "#00FFFF",
    "#9ACD32",
    "#808080",
    "#808000",
    "#FF00FF",
    "#DAA520",
    "#A52A2A",
    "#A0522D",
    "#069AF3",
    "#FF81C0",
    "#C5C9C7",
    "#000000",
    "#3D1C02",
    "#FF0000",
]

waypoint_markers = [
    "o",  # PLANET
    "o",  # GAS_GIANT
    ".",  # MOON
    "s",  # ORBITAL_STATION
    "^",  # JUMP_GATE
    "X",  # ASTEROID_FIELD
    "X",  # ASTEROID
    "X",  # ENGINEERED_ASTEROID
    "s",  # ASTEROID_BASE
    "D",  # NEBULA
    "X",  # DEBRIS_FIELD
    "H",  # GRAVITY_WELL
    "H",  # ARTIFICIAL_GRAVITY_WELL
    "P",  # FUEL_STATION
]
Each entry in waypoints_by_type is then enriched with a color and marker field:
for wp_type in types:
    waypoints_by_type[wp_type].update({
        "color":  waypoint_colors[waypoint_types.index(wp_type)],
        "marker": waypoint_markers[waypoint_types.index(wp_type)],
    })
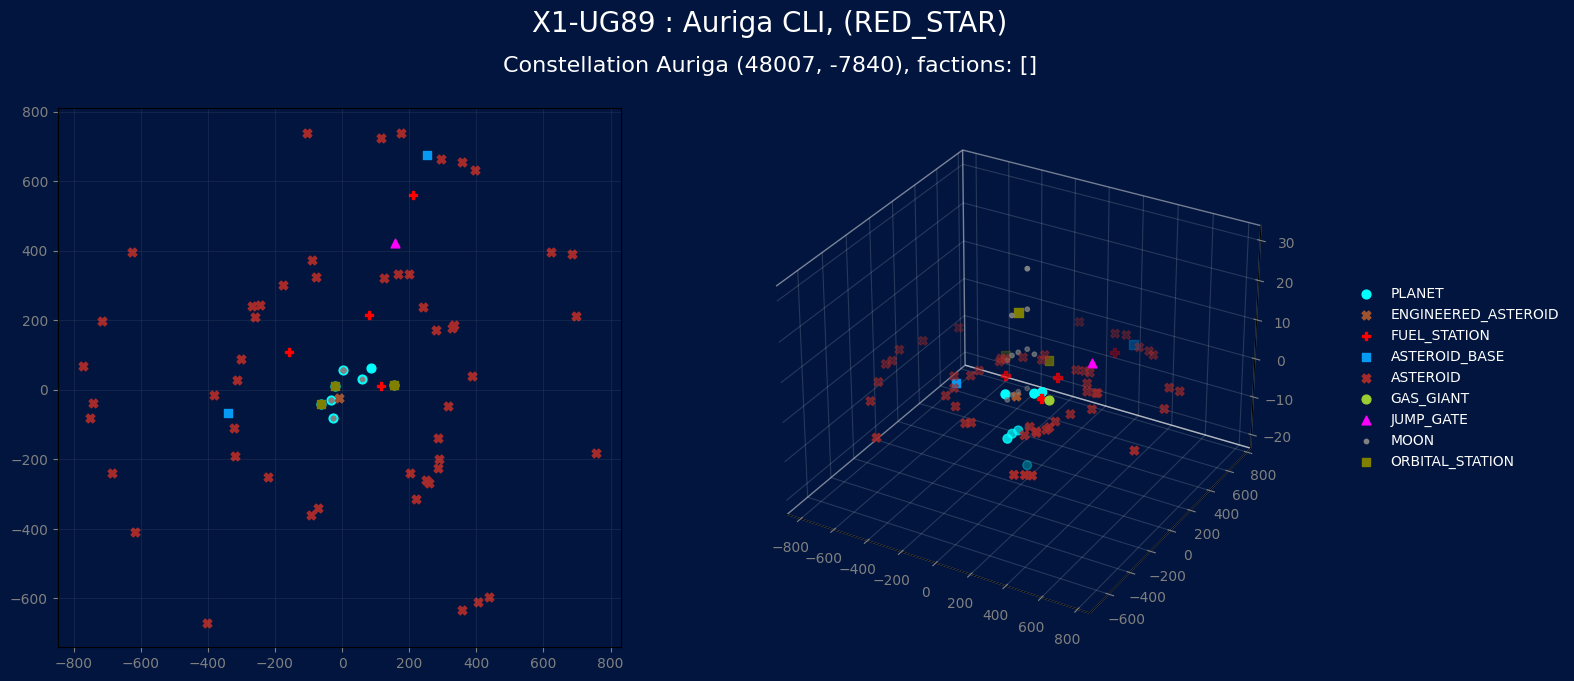
At this point a 2D scatter plot is already straightforward: scatter x_coordinates vs y_coordinates for each type, reuse color and marker, add a legend. That part is not very surprising.
The interesting problem appears when you try to move to 3D.
The overlapping waypoint problem
In the docs (and in practice), several waypoints share the same (x,y) coordinates. A planet, its moons, an orbital station, and a jump gate can all sit on top of each other numerically. In 2D that is fine, everything collapses into one symbol.
In 3D that turns into a mess. If you simply set z = 0 for every waypoint, a 3D scatter looks like a tilted 2D plot with some foreshortening. That is technically correct, but visually boring and not very informative.
The idea I wanted:
keep real X and Y from the API
invent a synthetic Z coordinate
use Z only to separate waypoints that occupy the same
(x, y)keep the spacing symmetric around zero
So every “stack” of waypoints at one coordinate becomes a tiny column along Z. The absolute value of the Z coordinate does not matter; what matters is that the column is centered and readable.
I tried to hack this together by iterating over a sorted list of waypoints and comparing each (x,y) pair with the previous one. That quickly turned into fragile code and off-by-one behavior. At that point, I gave up on pure “oldschool, no-AI” stubbornness and asked ChatGPT for help.
Grouping by (x,y) and assigning a fake Z coordinate
The first useful suggestion was to separate concerns:
build a flat list of
(symbol, x, y)tuplesgroup them by
(x,y)assign Z coordinates within each group
merge the result back into
waypoints_by_type
So, step one: create a flat list:
plot_points = []

for wp_type in waypoints_by_type:
    for i, symbol in enumerate(waypoints_by_type[wp_type]["symbol"]):
        x = waypoints_by_type[wp_type]["x_coordinates"][i]
        y = waypoints_by_type[wp_type]["y_coordinates"][i]
        plot_points.append((symbol, x, y))
Then sort by (x, y, symbol) for stable processing:
sorted_points = sorted(plot_points, key=lambda p: (p[1], p[2], p[0]))
Now I use a dictionary keyed by (x,y) to collect all waypoint symbols that share that coordinate:
groups = {}

for symbol, x, y in sorted_points:
    key = (x, y)
    groups.setdefault(key, []).append(symbol)
The core of the trick is how Z is assigned within each group. For a group of size n, the indices go from 0 to n-1. To center them around zero, I offset by (n - 1) / 2:
import numpy as np

spacing = 10
group_z = []

for key, symbols_at_xy in groups.items():
    n = len(symbols_at_xy)
    center = np.floor((n - 1) / 2)
    for i, symbol in enumerate(symbols_at_xy):
        z = (i - center) * spacing
        group_z.append((symbol, z))
Some examples:
one waypoint at
(x,y)→n = 1,center = 0, Z =0three waypoints → indices
0, 1, 2, center1, Z =[-10, 0, +10]five waypoints → indices
0..4, center2, Z =[-20, -10, 0, +10, +20]
Finally, I convert group_z into a simple lookup dictionary and enrich waypoints_by_type with a z_coordinates list that aligns with each symbol list:
z_map = {symbol: z for symbol, z in group_z}

for wp_type in waypoints_by_type:
    symbols = waypoints_by_type[wp_type]["symbol"]
    z_list = [z_map.get(symbol, 0) for symbol in symbols]
    waypoints_by_type[wp_type]["z_coordinates"] = z_list
This was the point where the AI assistant was genuinely helpful: I still wrote and adapted the code myself, but the hints about grouping by (x,y) first and centering indices made the problem much easier to reason about.
Titles, labels, and some basic styling
Before plotting anything, I extract some header information for the figure title:
system_header = {
    "name":         starting_system["data"]["name"],
    "constellation":starting_system["data"]["constellation"],
    "factions":     starting_system["data"]["factions"],
    "symbol":       starting_system["data"]["symbol"],
    "type":         starting_system["data"]["type"],
}

system_coordinates = (starting_system["data"]["x"], starting_system["data"]["y"])

title = f'{system_header["symbol"]} : {system_header["name"]}, ({system_header["type"]})'
subtitle = f'Constellation {system_header["constellation"]} {system_coordinates}, factions: {system_header["factions"]}
I also use a very simple configuration flag at the top of the notebook:
plot_both = True
plot_2d   = False
plot_3d   = False
so I can toggle individual views if needed. In practice I mostly use the combined view.
Plotting 2D and 3D views side by side
The final plotting cell produces one figure with two subplots: a 2D top-down map on the left and a 3D version on the right.
import matplotlib.pyplot as plt

if plot_both:

    plt.rcParams['text.color'] = '#FFFFFF'
    plt.rcParams['legend.framealpha'] = 0

    fig = plt.figure(facecolor="#01153E", figsize=(16, 7))

    # Left: 2D view
    ax2d = fig.add_subplot(1, 2, 1)
    ax2d.set_facecolor("#01153E")
    ax2d.tick_params(axis='x', colors='grey')
    ax2d.tick_params(axis='y', colors='grey')

    # Right: 3D view
    from mpl_toolkits.mplot3d import Axes3D  # only needed for some backends
    ax3d = fig.add_subplot(1, 2, 2, projection="3d")
    ax3d.set_facecolor("#01153E")
    ax3d.tick_params(axis='x', colors='grey')
    ax3d.tick_params(axis='y', colors='grey')
    ax3d.tick_params(axis='z', colors='grey')
Titles are drawn at the figure level so they apply to both subplots:
    fig.text(
        0.57, 1.0,
        title,
        ha='center',
        va='center',
        fontsize=20,
        color='white'
    )

    fig.text(
        0.57, 0.94,
        subtitle,
        ha='center',
        va='center',
        fontsize=16,
        color='white'
    )
The actual scatter calls reuse the same dictionary:
    for wp_type, data in waypoints_by_type.items():
        ax2d.scatter(
            'x_coordinates', 'y_coordinates',
            c='color',
            marker=data['marker'],
            data=data,
            s=40
        )

        ax3d.scatter(
            'x_coordinates', 'y_coordinates', 'z_coordinates',
            c='color',
            marker=data['marker'],
            data=data,
            s=40,
            depthshade=True,
        )
Grids and pane tweaks keep the 3D view readable on a dark background:
    ax2d.grid(alpha=0.1)
    ax3d.grid(True)

    for axis in (ax3d.xaxis, ax3d.yaxis, ax3d.zaxis):
        axis.pane.fill = False
        axis._axinfo["grid"]["color"] = (1, 1, 1, 0.15)
Finally, I adjust the 3D axis position slightly and attach the legend there so it does not overlap the 2D plot:
    box = ax3d.get_position()
    ax3d.set_position([box.x0, box.y0, box.width * 1.0, box.height])
    ax3d.legend(waypoints_by_type, loc='center left', bbox_to_anchor=(1.1, 0.5))

    plt.show()
The result is a compact “system dashboard”: a top-down map for navigation on the left, and a spatial view on the right that shows which waypoints stack on top of each other.
What this enables next
With this small visual layer in place, a few ideas open up:
highlighting waypoints that have MARKETPLACE or SHIPYARD traits
overlaying ship positions and planned routes
combining this with the PostgreSQL database to display historical price information directly on the map
making the plot generator part of a small CLI or web dashboard
The nice part is that none of this requires new API concepts. It is the same data as before, just presented in a way that makes the universe feel less abstract. I am not sure when, or if, I am going to continue with the UI concepts. It’s something always open for improvement, and interesting to play with, but I believe at this very early stage, this may be all I need for a while, and most likely, I will try to “play the game” a little before investing more time into visualizing things in the universe. On the other hand, the next reset is tomorrow, and I still have no idea what I want to put my hands into next, so we will see!