IBM Python Project for Data Engineering:
Web Scraping and ETL Automation Project – Top 10 Global Banks
As part of IBM’s Python Project for Data Engineering, I was tasked with building a full ETL pipeline to extract and process financial data for the world’s largest banks. The project involved real-world web scraping, data transformation using exchange rates, and saving outputs to both CSV and SQL database formats - all automated with progress logging.

Overview:
Project Goal
To automate the creation of a quarterly market capitalization report for the top 10 largest banks in the world.
Scrape data from an archived Wikipedia page using
requests+BeautifulSoupExtract a specific table from the HTML (by inspecting its position in
<tbody>)Filter and clean relevant rows (skip rows with missing data or no hyperlinks)
Convert market capitalization from USD to GBP, EUR, and INR using an external exchange rate CSV
Store the result in a CSV file and an SQLite database
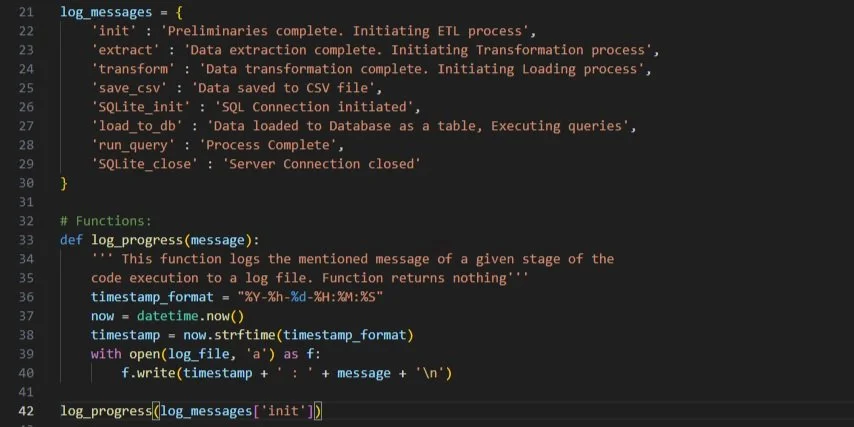
Log each phase of the ETL process into a
code_log.txtfile
Tools & Stack
Python: Core programming logic
BeautifulSoup4: HTML parsing & web scraping
Pandas: Data cleaning and transformation
NumPy: Vectorized currency conversion
SQLite3: Local database storage
CSV: Flat file output
Datetime: Timestamped logging for process traceability
Highlights
Learned to inspect web structure to target specific
<tbody>sections and handle multiple<a>tags within a single cell.Dealt with real-world scraping errors like SSL certificate warnings and how to bypass them safely for non-sensitive archival content.
Practiced modular programming: each ETL phase was written as a self-contained function with docstrings and error tolerance.
Understood how to log process checkpoints for traceability — an essential practice in real ETL pipelines.
ETL Workflow:
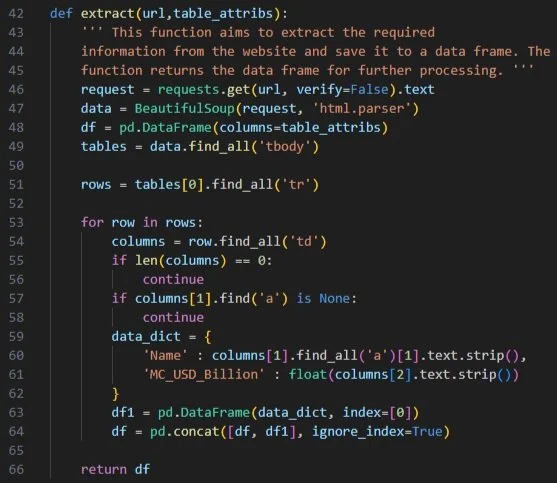
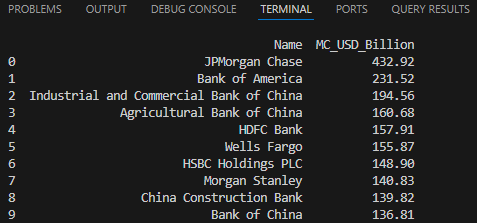
Task 2: Extract – Web Scraping with BeautifulSoup
The table under “By Market Capitalization” was found at index 0 in the <tbody> list. I filtered only valid rows (that had links and valid GDP) and extracted both the name and USD market cap.
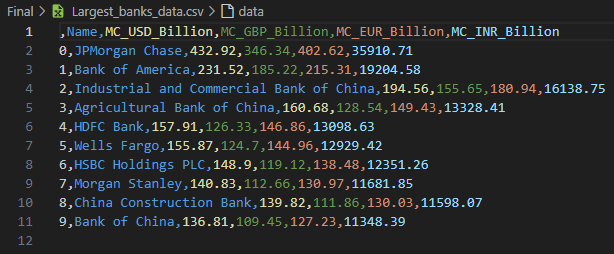
Task 3: Transform – Exchange Rate Conversion
Using a CSV of exchange rates, I multiplied USD values by the appropriate rates for GBP, EUR, and INR, rounded to 2 decimal places. Vectorized NumPy operations ensured performance and precision.
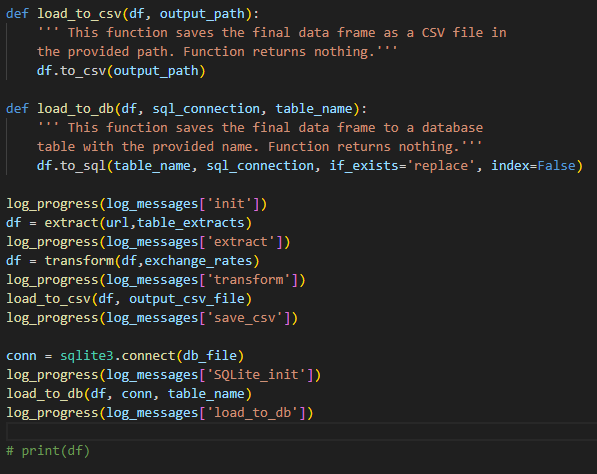
Task 4 & 5: Load to CSV and Database
The final DataFrame was saved in two formats:
CSV using
pandas.to_csvSQLite using
to_sql(..., if_exists='replace')
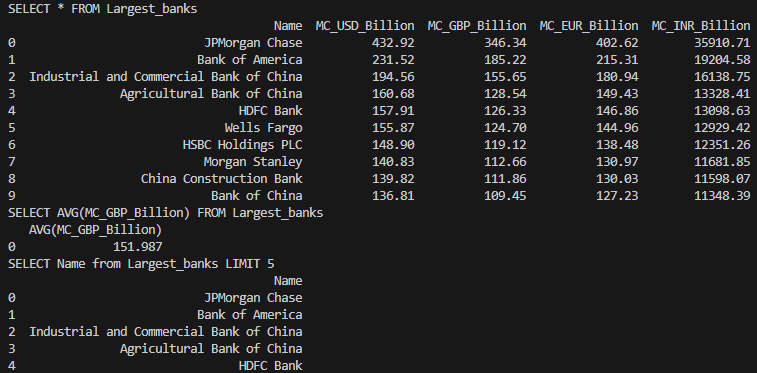
Task 6: SQL Query Execution
Sample queries run:
SELECT * FROM Largest_banks;
SELECT AVG(MC_GBP_Billion) FROM Largest_banks;
SELECT Name FROM Largest_banks LIMIT 5;
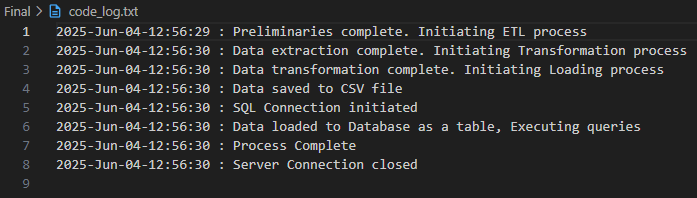
Task 7: Log Review
Final inspection of code_log.txt confirms all steps logged correctly.
Final Output Sample
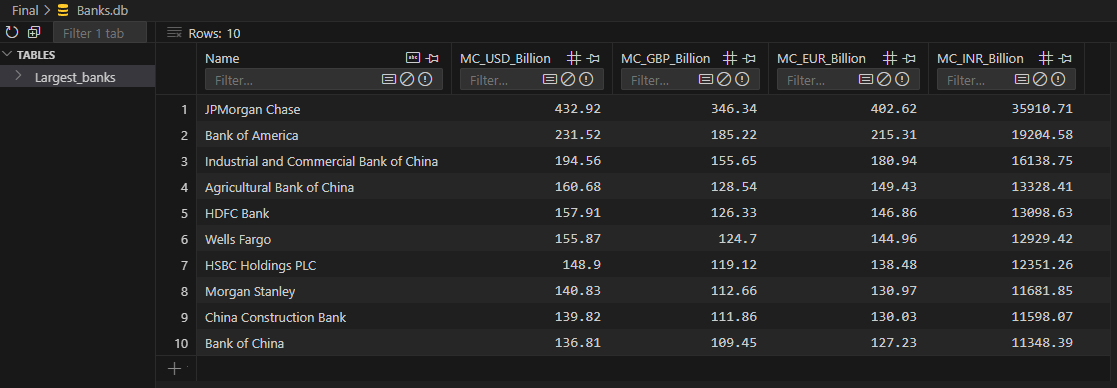
(Full dataset exported to
Largest_banks_data.csvand stored inBanks.dbSQLite table)
Reflections
This was a solid capstone project for cementing real-world ETL skills. It required breaking down unstructured HTML, designing a pipeline architecture, and understanding how to preserve reproducibility through logs and clean storage. In future versions, I’d like to refactor it into a CLI tool or deploy it as a microservice for quarterly automation.
Task 1: Logging Function
A timestamped log_progress() function tracks every stage of the ETL pipeline in a .txt file — useful for future debugging or audits.